
Software Engineering Jobs Are Up 13.5%. Why that stat lies and where the growth is in AI
What 45 million job postings from Revealera reveal about AI, software engineering, and the metric everyone should be tracking instead.

The Number Everyone Gets Wrong
Software engineering job postings are up 13.5% from 2023 to 2025.
So is the doomer narrative about job postings overblown? The fact is, AI isn’t killing software engineering — hiring is growing, share of total Software Engineering job postings is climbing.
Except it isn’t. Because here’s the other number: the equal-weighted average across 11 industry sectors shows SWE postings down 11.3% over the same period. Both numbers are simultaneously true.
How is that possible? Because in a classic case of Simpson’s paradox, two sectors — Technology and Financial Services — are so large and growing so fast that they completely mask what’s happening everywhere else.
We analyzed 45.4 million job postings across 37 months (January 2023 through January 2026), spanning 4,000+ companies and 11 industry sectors, sourced from the Revealera jobs database. The data tells a story that’s more nuanced — and more interesting — than either the doomers or the optimists are getting right.
The real signal isn’t SWE decline or SWE growth. It’s AI-SWE convergence. And it’s accelerating.
Two Sectors Are Hiding the Decline
Let’s unpack that paradox.
When you look at SWE job postings sector by sector using STL trend decomposition (which strips out the enormous seasonal hiring cycles), you find that: 8 out of 11 sectors show declining SWE trends.
The declines are not small:
Basic Materials: -47.3%
Utilities: -46.7%
Communication Services: -39.9%
Consumer Defensive: -31.7%
Consumer Cyclical: -30.3%
Industrials: -21.4%
Real Estate: -8.4%
Healthcare: -2.2%
But Technology is up +64.9% and Financial Services is up +29.1%. Together, these two sectors accounted for 55% of all SWE postings in 2023 and grew to 66% by 2025. Their sheer volume drowns out the other nine sectors in any aggregate measure.
If you asked 11 sector heads whether SWE hiring was growing, 8 would say no. The aggregate says yes because it’s volume-weighted, and the two biggest sectors are booming.
This matters because your personal experience of the job market depends on your sector, not the headline. If you’re a software engineer in manufacturing, utilities, or communications, the aggregate +13.5% is fiction. Your market is contracting.
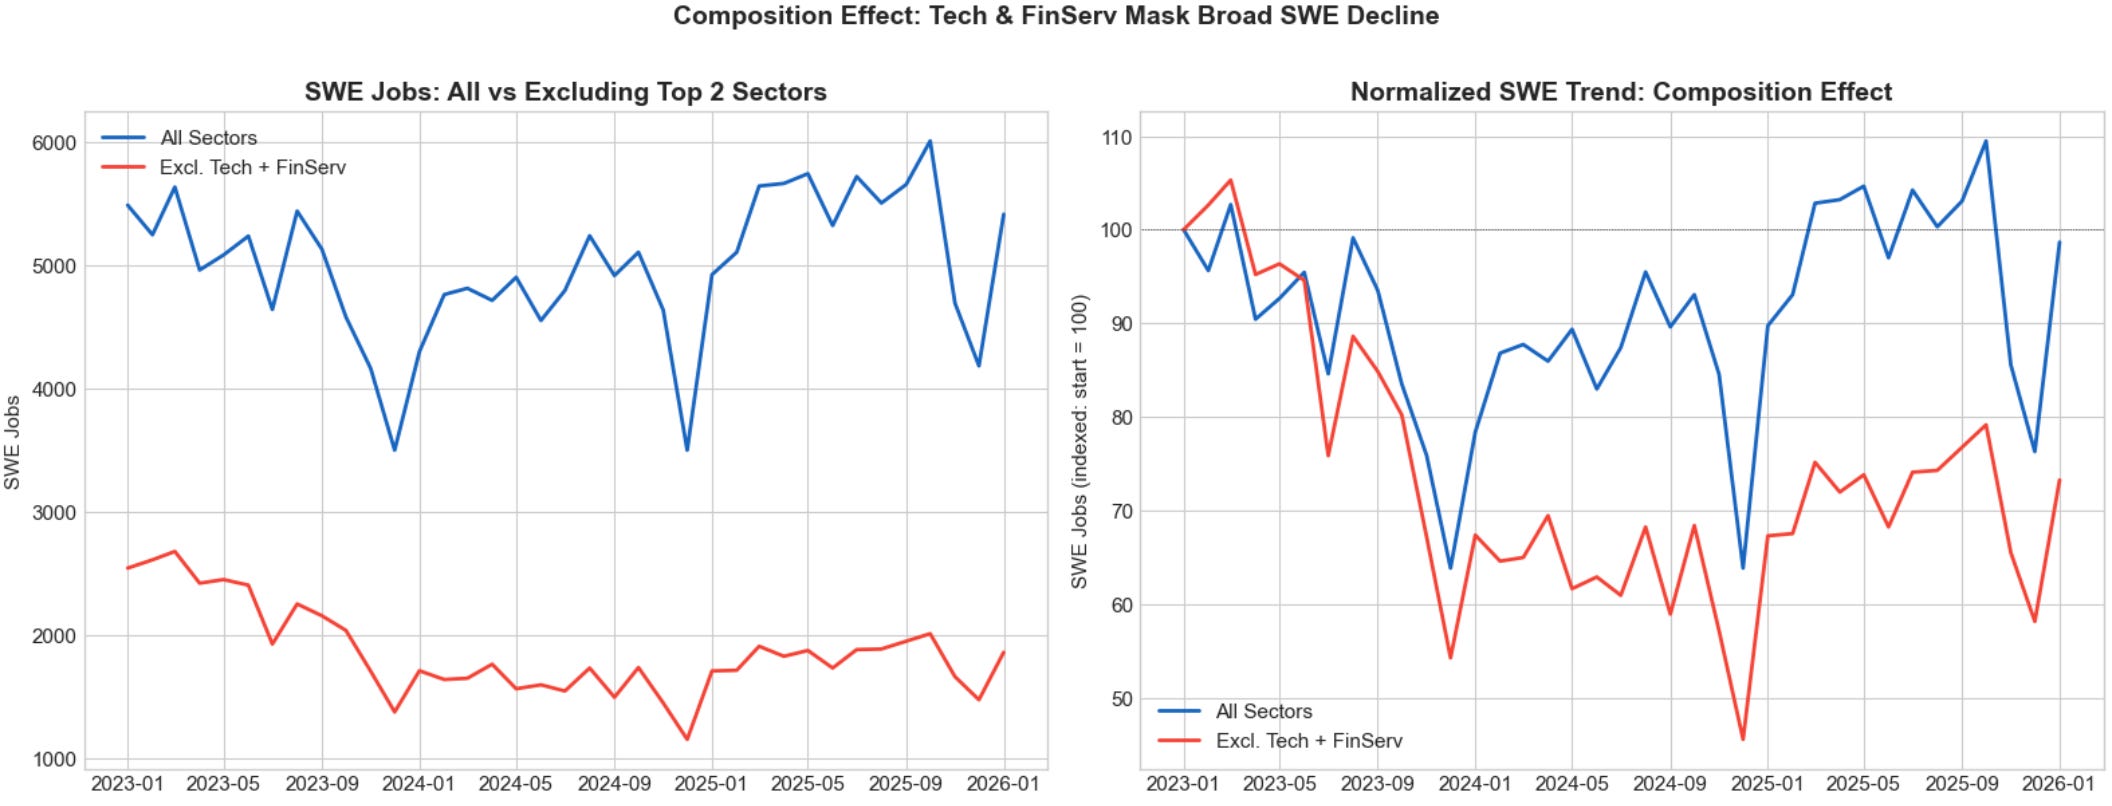
Volume-weighted aggregate SWE change: +8.5%. Equal-weighted sector average: -11.3%. The divergence is 19.9 percentage points.
The Number That Actually Matters: 0.28 to 0.66
Instead of asking “are SWE jobs going up or down?” — which, as we’ve seen, depends on how you weight the sectors — we ask a different question: what’s happening between AI and SWE job postings?
In January 2023, the AI/SWE ratio was 0.275 — for every SWE posting, there were roughly 0.28 AI postings. By January 2026, that ratio had climbed to 0.658. AI job postings are converging on SWE at a rate of +0.0106 per month, and the pace accelerated in the second half of 2025.
The half-year progression tells the story:
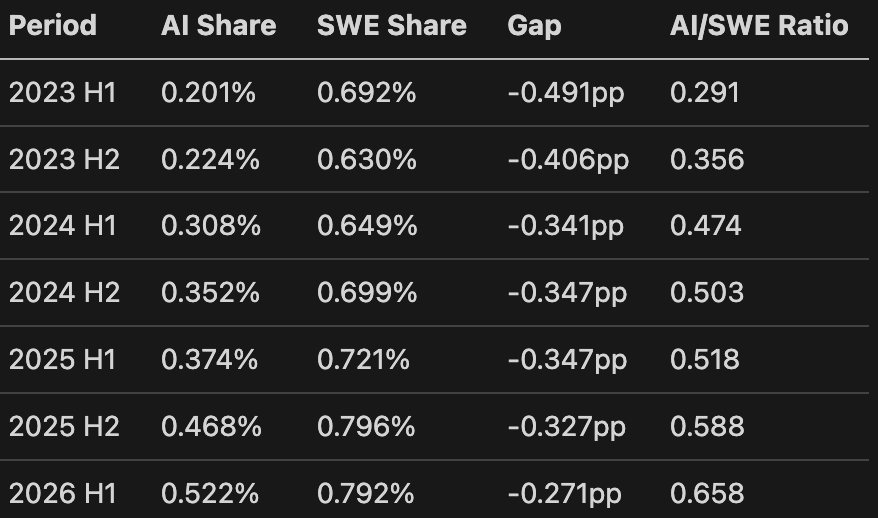
At the current rate, the AI/SWE ratio reaches 0.75 in roughly 9 months.
Both AI and SWE are growing as a share of total job postings. But AI is growing 3.2x faster in share-weighted terms. Over the full period, AI postings rose 96.1% while SWE rose 13.5%. The convergence is steady, broad-based, and — based on 3-month rolling momentum — AI share was gaining faster than SWE in 8 of the last 13 months.
The convergence ratio is the cleanest signal in this dataset. It’s monotonically increasing, it normalizes against total market fluctuations, and it’s visible across sectors. It’s a better metric than absolute SWE counts, which are dominated by seasonal noise and composition effects.
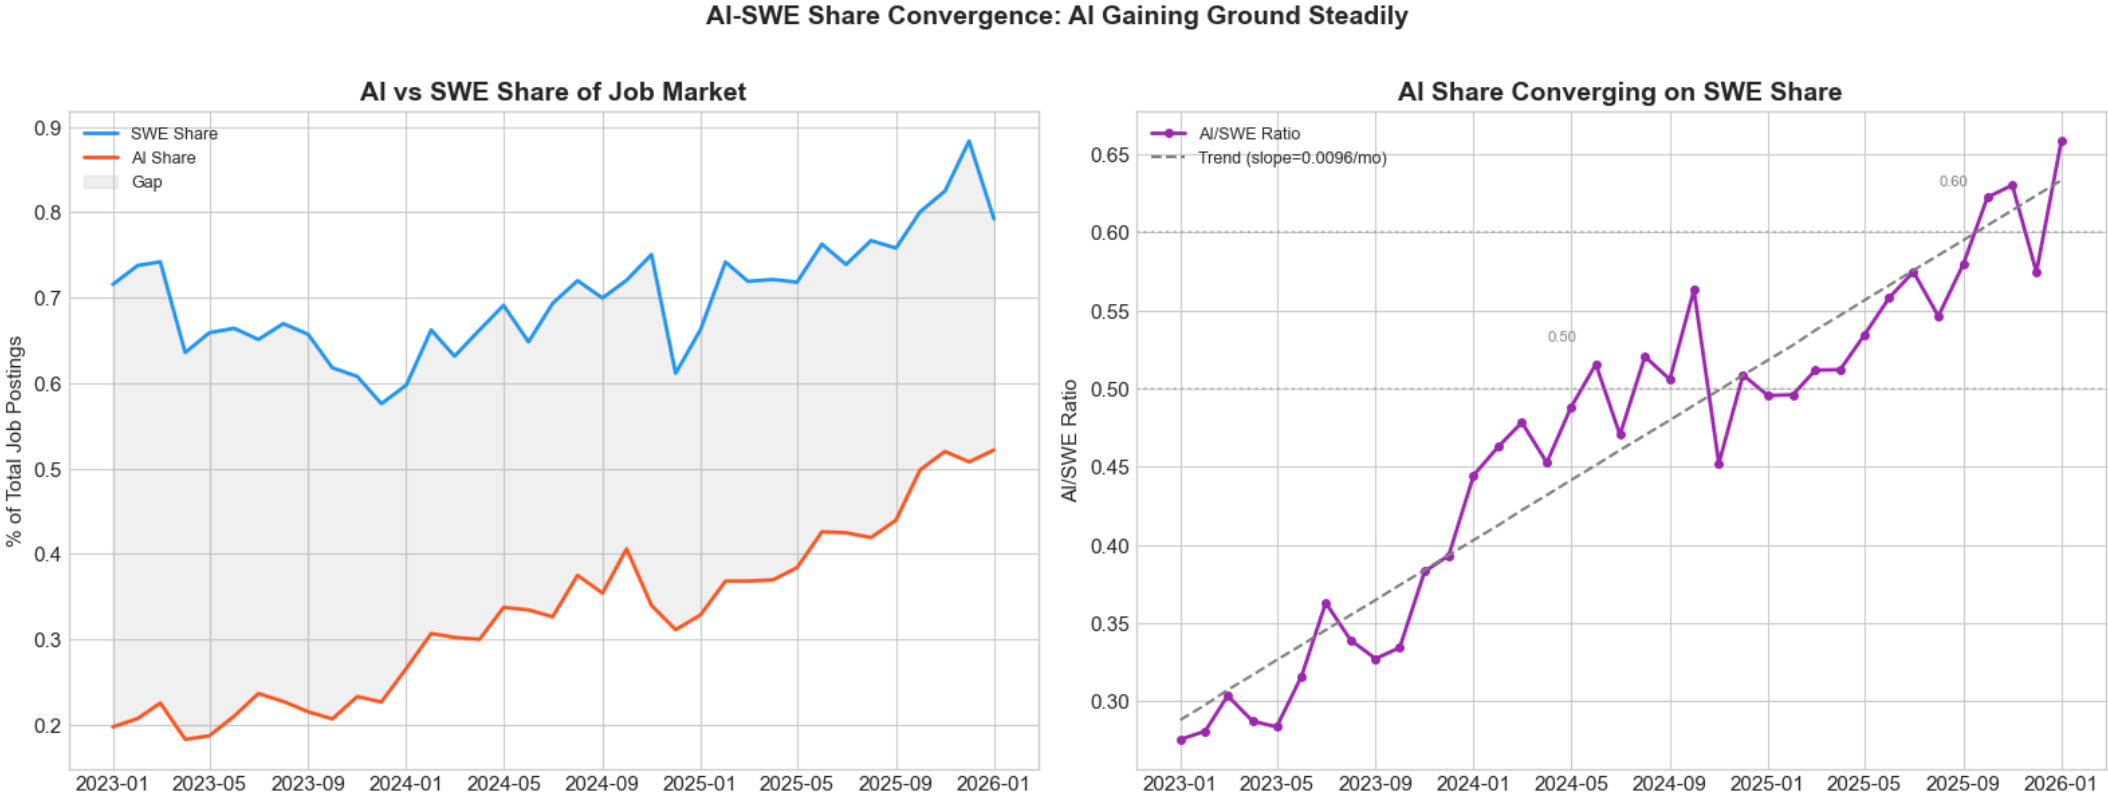
Left: AI and SWE share of total postings with converging gap shaded. Right: AI/SWE ratio climbing from 0.28 to 0.66 with OLS trend line.
AI Adoption Is Everywhere, Not Just Big Tech
One objection to the convergence story is that it’s just a Big Tech hiring cycle — FAANG companies relabeling roles or going on an AI hiring spree that inflates the numbers.
The sector data says otherwise. AI job postings are growing in 10 out of 11 sectors:
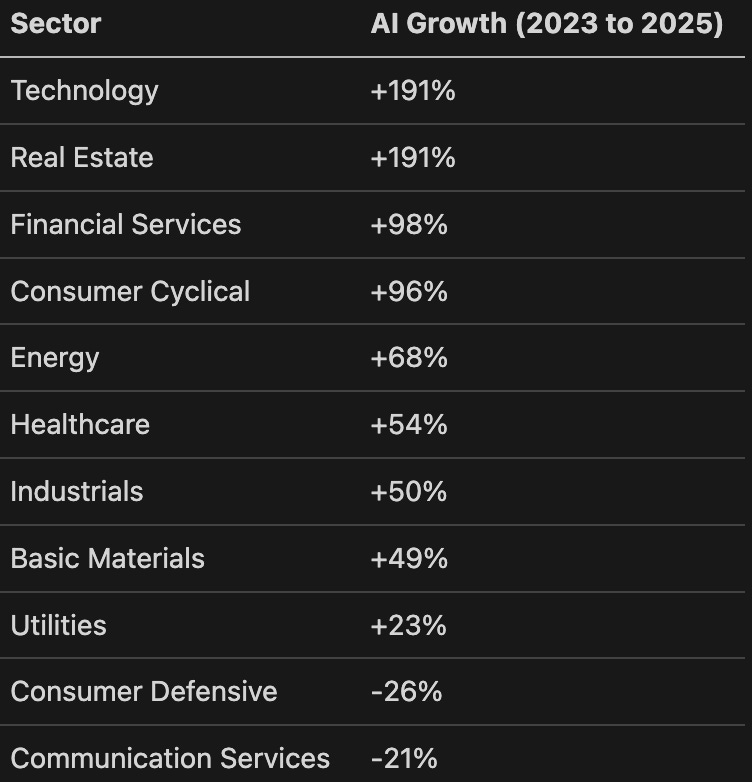
The growth is broad. Healthcare (+54%), Industrials (+50%), and Energy (+68%) are all adding AI roles at substantial rates. Real Estate — a sector where you might not expect heavy AI adoption — matches Technology’s +191% growth rate (albeit from a smaller base). Only Consumer Defensive and Communications are contracting.
This is the strongest finding in the data. The evidence that AI is transforming hiring across industries is unambiguous: 10 of 11 sectors, accelerating share convergence, and a median AI salary premium of +18% ($169,800 vs. $143,877 for SWE roles).
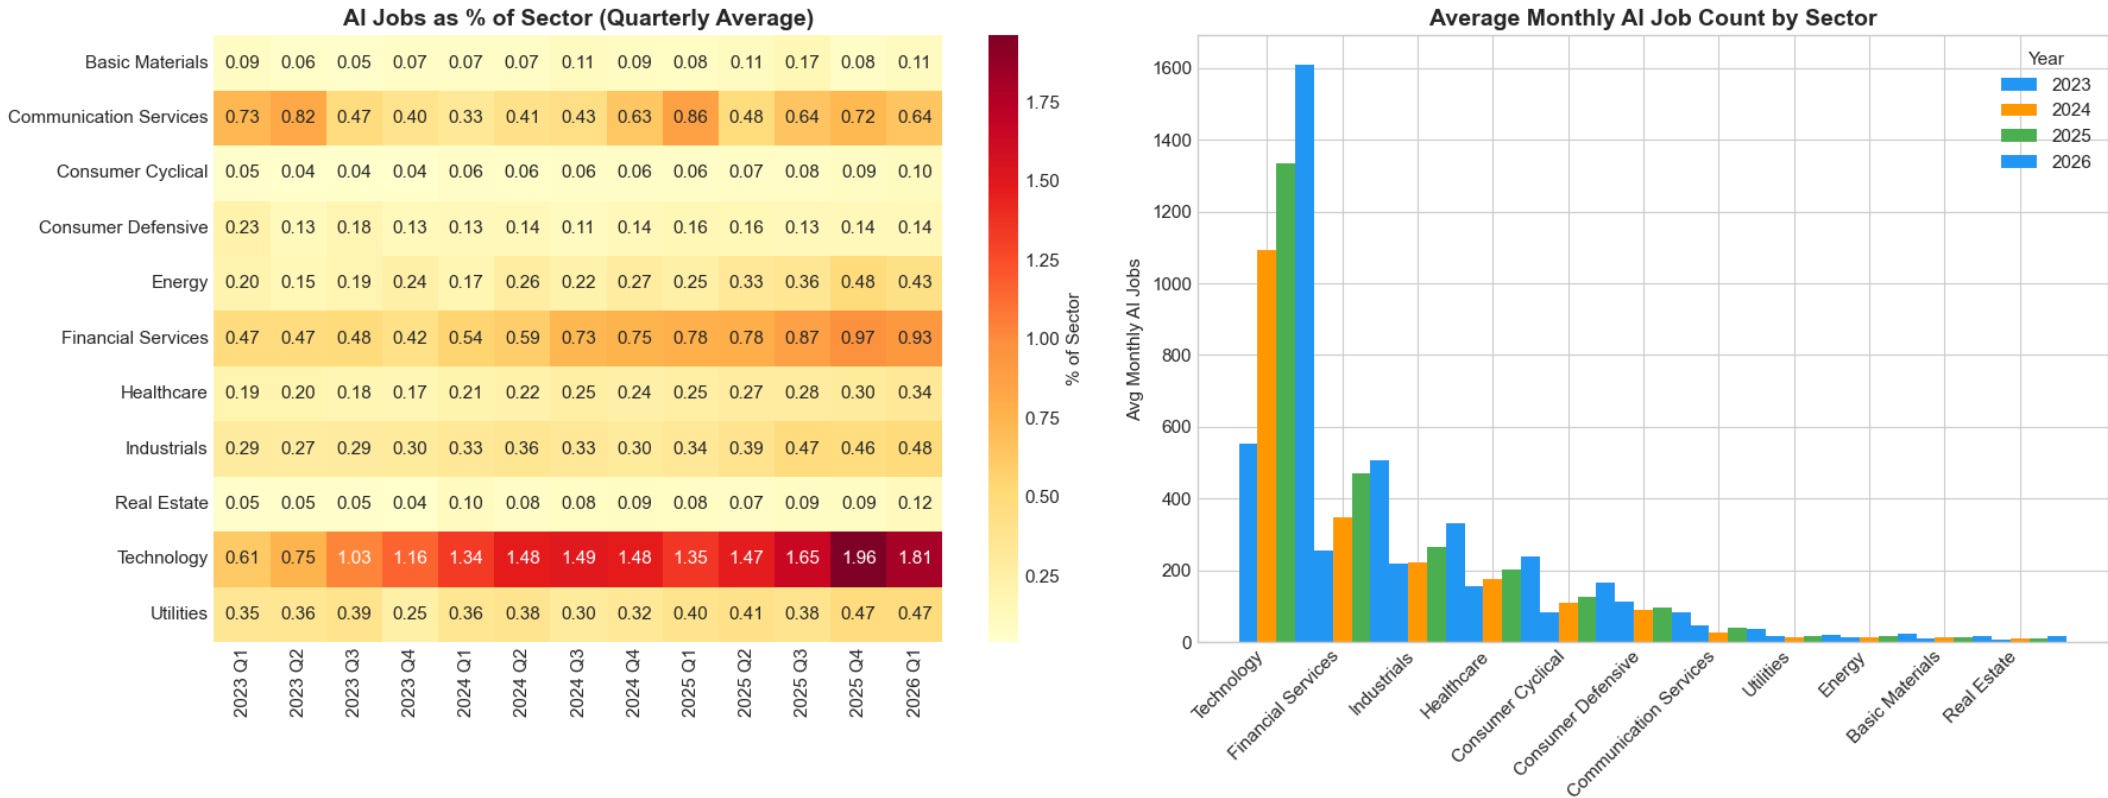
AI as a percentage of sector job postings, by quarter. The gradient is intensifying across nearly every row — not just Technology.
LLMs, Copilot, RAG: The New Stack
What specifically are employers hiring for? Using Revealera’s product mention tracking across 28 AI-related technologies, the picture is striking.
Generative AI tools dominate and are growing rapidly:
LLMs: mentioned in 1.20% of AI job postings
Copilot: 0.65%
RAG (retrieval-augmented generation): 0.58%
ChatGPT: 0.41%
Claude: 0.33%
Gemini: 0.33%
Meanwhile, traditional ML frameworks remain stable but aren’t growing:
PyTorch: 0.64%
TensorFlow: 0.57%
NLP: 0.43%
scikit-learn: 0.25%
The key insight: GenAI demand is additive, not substitutive. Traditional ML mentions haven’t declined — employers still want PyTorch and TensorFlow skills. But they’re layering GenAI requirements on top, and those mentions are climbing from near-zero post-ChatGPT’s launch to dominant positions in under two years.
The salary data reinforces this. AI roles command a median $169,800 — an 18% premium over SWE’s $143,877. Employers are paying up for these skills because the supply hasn’t caught up with demand.
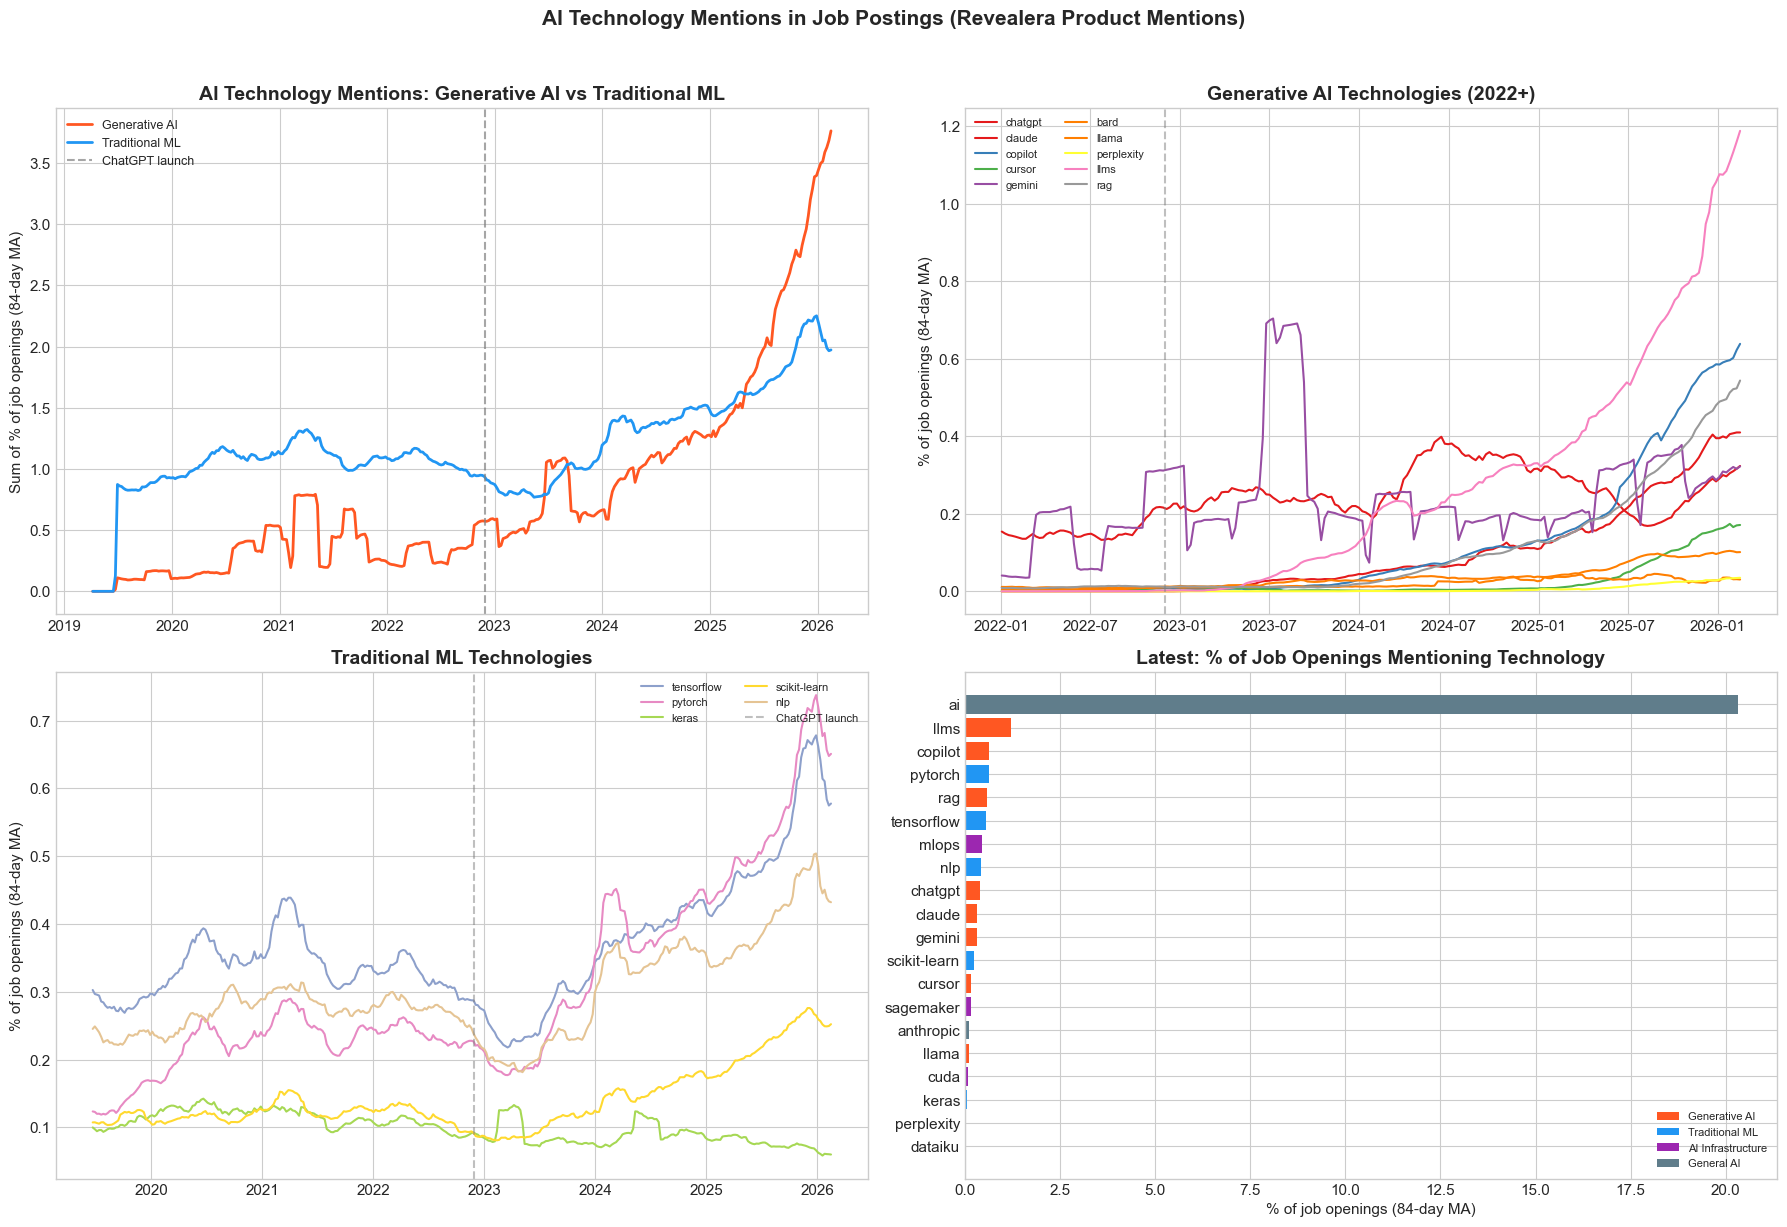
Technology mentions in AI job postings. Generative AI tools (LLMs, Copilot, RAG) are rocketing from near-zero, while traditional ML (PyTorch, TensorFlow) holds steady.
What This Data Cannot Tell You
Before you restructure your career around these findings, here are the caveats that most AI job market takes conveniently skip.
The signal-to-noise problem is severe. Job posting volumes have a massive seasonal cycle — the hiring dip in Q4 and recovery in Q1 creates swings of about 4,072 jobs, which is 47.5% of the mean monthly SWE volume. The total trend change over the entire 37-month period is only 1,685 jobs — less than half the seasonal swing. The signal-to-noise ratio is 0.41, which is poor. Any trend claim needs to be interpreted with extreme caution.
Correlation is not causation. Even in the 8 sectors where SWE postings are declining, we cannot prove AI caused it. Interest rate cycles, post-COVID normalization, budget tightening, and industry-specific dynamics all overlap with the same time period. The composition effect is real; the attribution is speculative.
Job postings are not employment. A posting is a signal of intent, not a hire. Companies may post fewer jobs while hiring the same number of people (through referrals, internal transfers, or retained agencies that don’t show up in posting databases).
The formal scorecard is underwhelming. We tested 7 distinct signals for SWE decline. Only 2 fired: growth is decelerating and SWE is declining when you exclude Tech and FinServ (composition-adjusted). The other 5 — absolute level, market share, full-period trend, year-over-year majority, and recent velocity — all point toward growth or stability.
37 months is short. With a 12-month seasonal cycle, we have barely 3 full cycles of data. That’s enough to identify patterns but not enough for high-confidence trend detection, especially when the seasonal noise overwhelms the signal.
Start Tracking AI/SWE Convergence.
So we think a good stat to track going forward is : how fast is the AI/SWE convergence happening, and what does it mean for how companies hire?
In 2023, “AI roles” and “SWE roles” were clearly distinct categories. By late 2025, they’re merging. The AI/SWE ratio has gone from 0.28 to 0.66, and the convergence is accelerating. The practical question isn’t whether your company needs “AI people” or “SWE people” — it’s how much AI fluency your engineering roles will require next year.
If you’re a software engineer: the $26K salary premium for AI skills is real and consistent. AI fluency — not just ML theory, but practical GenAI tools like LLMs, RAG, and Copilot — is the highest-ROI career investment in the current market.
If you’re a hiring manager outside Tech or FinServ: the 8-out-of-11 sector decline is real even though the aggregate masks it. Your SWE candidate pool is shrinking. The engineers you want are migrating toward AI-heavy roles, and the premium reflects it.
If you’re an analyst or journalist: stop using aggregate SWE job counts. They’re compositionally misleading. Use sector-adjusted metrics or equal-weighted averages. The AI/SWE convergence ratio is a cleaner signal with less seasonal noise.
We’ll update this analysis quarterly. The convergence ratio is the number to watch.
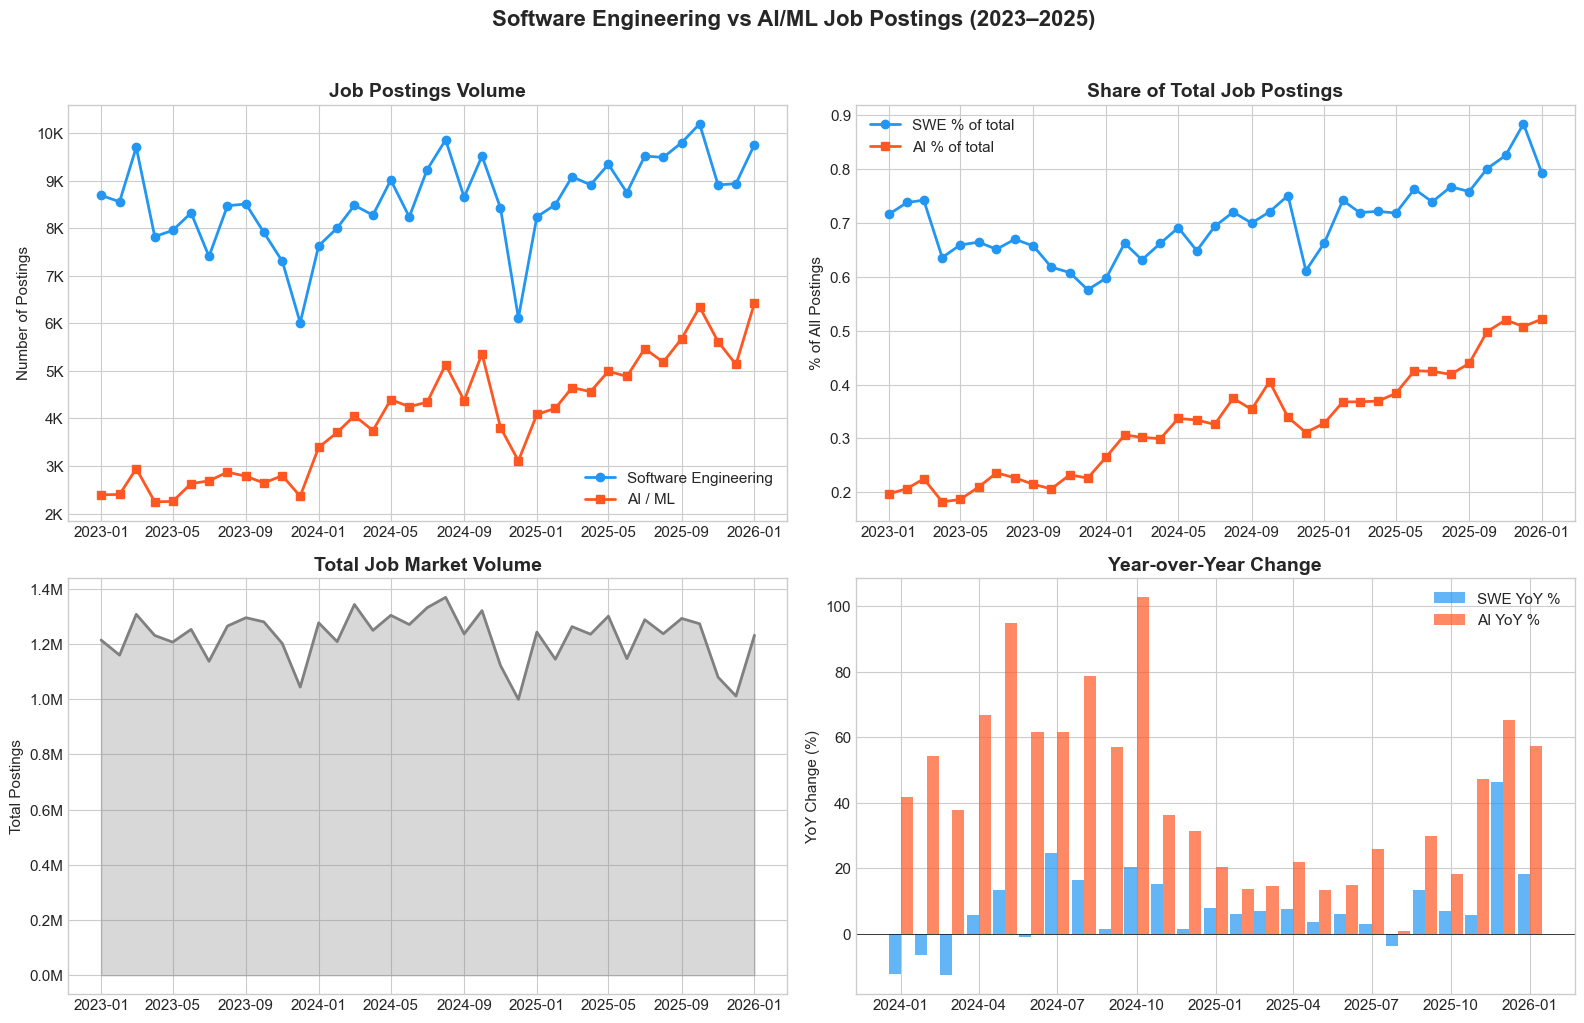
The full picture: SWE and AI absolute counts (top-left), share of total postings (top-right), total market volume (bottom-left), and year-over-year change (bottom-right). Now you have the tools to read these charts properly.
Methodology: This analysis covers 45.4 million job postings from January 2023 through January 2026, sourced from the Revealera jobs database. SWE and AI jobs are classified using keyword and title matching across 4,000+ companies and 11 GICS-based industry sectors. Trend analysis uses STL decomposition (period=12, seasonal=7, robust=True) with Mann-Kendall tests on deseasonalized series. Technology mentions are tracked via Revealera’s RevealeraProduct Mentions API across 28 AI-related tools and frameworks. Salary data covers approximately 1,200 AI roles and 2,300 SWE roles per month with reported compensation.